
Advertisement
-
Published Date
September 10, 2025This ad was originally published on this date and may contain an offer that is no longer valid. To learn more about this business and its most recent offers, click here.
Ad Text
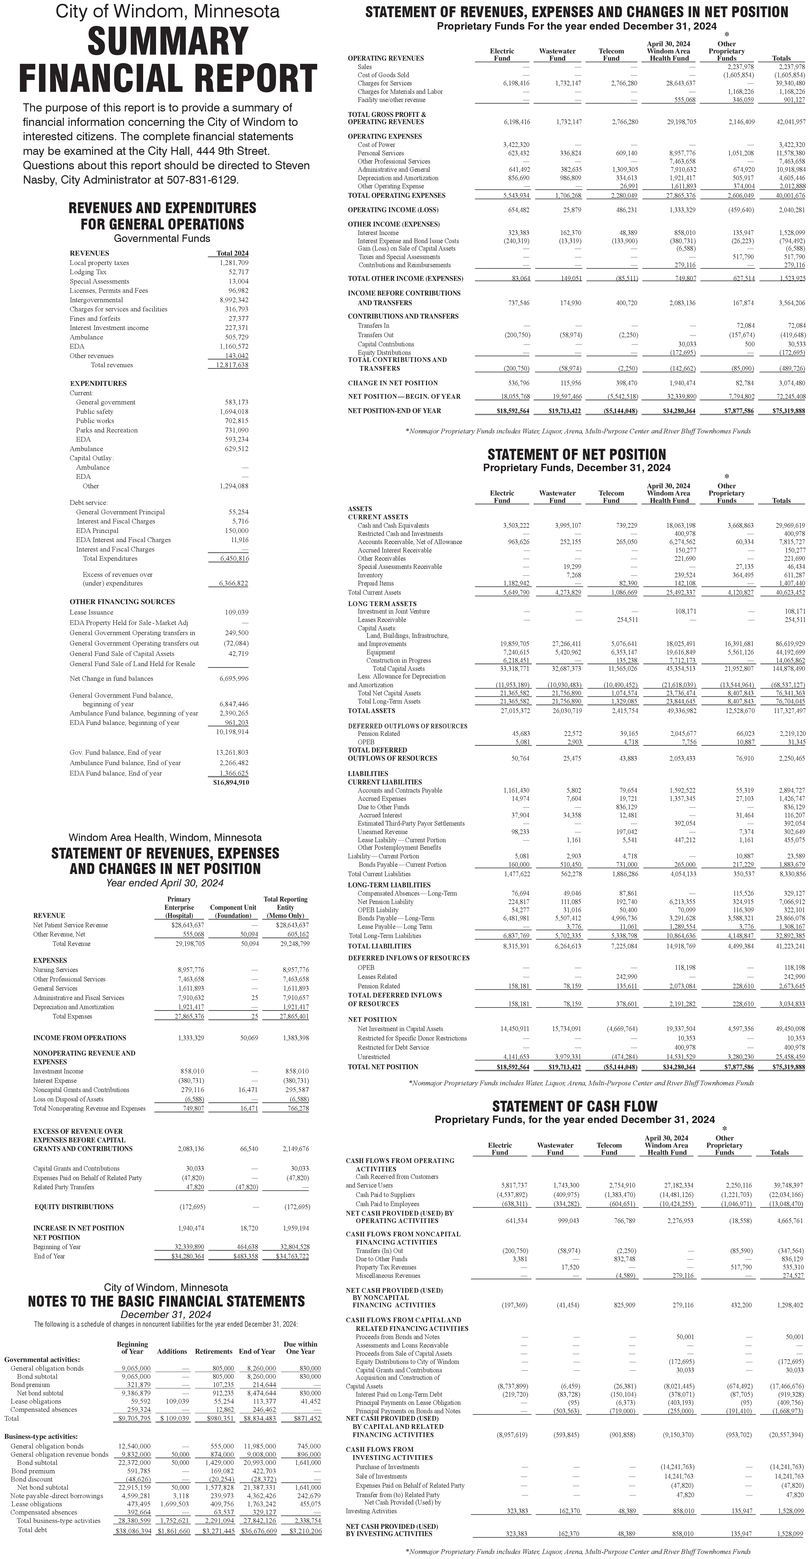
REVENUES Local property taxes Total 2024 1,281,709 City of Windom, Minnesota SUMMARY FINANCIAL REPORT The purpose of this report is to provide a summary of financial information concerning the City of Windom to interested citizens. The complete financial statements may be examined at the City Hall, 444 9th Street. Questions about this report should be directed to Steven Nasby, City Administrator at 507-831-6129. REVENUES AND EXPENDITURES FOR GENERAL OPERATIONS Governmental Funds Sales OPERATING REVENUES Cost of Goods Sold Charges for Services Charges for Materials and Labor Facility use other revenue TOTAL GROSS PROFIT & OPERATING REVENUES OPERATING EXPENSES Cost of Power Personal Services Other Professional Services Administrative and Gen Depreciation and Amortization Other Operating Expense TOTAL OPERATING EXPENSES OPERATING INCOME (LOSS) OTHER INCOME (EXPENSES) Interest Income Interest Expense and Bond Issue Costs Gain (Loss) on Sale of Capital Assets Taxes and Special Assessments Contributions and Reimbursements STATEMENT OF REVENUES, EXPENSES AND CHANGES IN NET POSITION Proprietary Funds For the year ended December 31, 2024 Electric Fund Wastewater Fund Telecom Fund April 30, 2024 Windom Area Health Fund Other Proprietary Funds Totals 2,237,978 (1,605,854) 2.237,978 6,198,416 1,732,147 2,766,280 28,643,637 (1,605,854) 39,340,480 555,068 1,168,236 346,059 1,168,226 901,127 6,198,416 1,732,147 2,766,280 29,198,705 2,146,409 42,041,957 3,422,320 3,422,320 623,432 336,824 609,140 8957,776 1,051,208 11.578.380 7,463,658 7,463,658 641,492 382,635 1,309,305 7,910,632 674,920 10,918,984 856,690 986,809 334,613 1,921,417 505,917 4,605,446 26991 1611803 374004 2012.08 5.543934 1,206,268 2.280089 27.865 376 2606019 40.001,676 654,482 25,879 486,231 1,333.329 (459,640) 2,040,281 323,383 162,370 (240,319) (13,319) 48,389 (133,900) 135,947 1,528,099 (380,731) 36223) (794,492) $17,790 279.116 279.116 Lodging Tax 52.717 Special Assessments 13,004 TOTAL OTHER INCOME (EXPENSES) 83,064 149,061 (85.511) 749.807 627514 1.523.925 Licenses, Permits and Fees 96,982 Intergovernmental 8,992,342 INCOME BEFORE CONTRIBUTIONS AND TRANSFERS 737,546 174,930 400,720 2,083,136 167,874 3,564,206 Charges for services and facilities 316,793 Fines and forfeits 27,377 Interest Investment income 227,371 CONTRIBUTIONS AND TRANSFERS Transfers In 72,084 72,084 Ambulance 505,729 Transfers Out (200,750) (58974) (2,250) (157,674) (419,648) EDA Other revenues 1,160,572 Capital Contributions Total revenues 143,042 12.817.638 Equity Distributions 30,033 (172.605) (172.695) TOTAL CONTRIBUTIONS AND TRANSFERS (200,750) (58,974) (2,250) (142662) (85.090) EXPENDITURES CHANGE IN NET POSITION 536,796 115,956 398,470 1,940,474 Current NET POSITION-BEGIN, OF YEAR 18,055,708 General government 583,173 Public safety 1,694,018 NET POSITION-END OF YEAR $18,592,564 19,597,466 $19,713,422 (5.542.518) ($5,144,848) 37.330.800 82,784 7.394802 3,074,480 72.245.408 $34,280,364 $7.877.586 $75.319.888 Public works 702,815 Parks and Recreation 731,090 EDA 593.234 Ambulance 629,512 Capital Outlay: Ambulance *Nonmajor Proprietary Funds includes Water, Liquor, Arena Multi-Purpose Center and River Bluff Townhomes Funds STATEMENT OF NET POSITION Proprietary Funds, December 31, 2024 EDA Other 1,294,088 Debt service: Electric Fund Wastewater Fund Telecom Fund April 30, 2024 Windom Area Health Fund Other Proprietary Funds Totals ASSETS General Government Principal 55,254 CURRENT ASSETS Interest and Fiscal Charges 5,716 Cash and Cash Equivalents 3,503,222 3,995,107 EDA Principal 150,000 Restricted Cash and Investments EDA Interest and Fiscal Charges Accounts Receivable, Net of Allowance 963,636 252,155 739,229 265,050 18,063,198 3,668,863 29,969,619 400,978 400,978 6,274,562 60,334 7,815,727 Interest and Fiscal Charges Accrued Interest Receivable 150,277 150,277 Total Expenditures 6.450,816 Other Receivables 221,690 221,690 Special Assessments Receivable 19,299 27,135 46,434 Excess of revenues over (under) expenditures OTHER FINANCING SOURCES Lease Issuance Inventory 7,268 239,524 364,495 611,287 6366822 Prepaid Items Total Current Assets 1.18942 5,649,790 87.300 142.108 1407440 4,273,829 25.492.337 4,120,827 40,623,452 LONG TERM ASSETS 109,039 Investment in Joint Venture 108,171 108,171 EDA Property Held for Sale-Market Adj Leases Receivable 254,511 254,511 General Government Operating transfers in 249,500 Capital Assets Bucure General Government Operating transfers out (72,084) General Fund Sale of Capital Assets 42,719 Equipment General Fund Sale of Land Held for Resale Construction in Progress Total Capital Assets 19,859,705 7,240,615 6218.451 33,318,771 27,266,411 5,420,962 32,687,373 5,076,641 6,353,147 135.238 11,565,026 18,025,491 19,616,849 7712.173 45,354,513 16,391,681 5,561,126 86,619,929 44,192,699 21,952,807 14.065.862 144,878,490 Net Change in fund balances 6,695,996 Less: Allowance for Depreciation and Amortization (11.953,189) (10.90.483) (10.490.45%) General Government Fund balance, Total Net Capital Assets 21.35582 21.756800 beginning of year 6,847,446 Total Long-Term Assets 21.365482 21.756800 1074.574 1.320.085 C1618.019) 23,736.474 23.844645 (13.541964) Ambulance Fund balance, beginning of year 2.390,265 TOTAL ASSETS 27,015,372 26,030,719 2,415,754 49,336,982 8.407.843 8407843 12.528,670 76.341.36 76,704085 117,327,497 EDA Fund balance, beginning of year 961.203 DEFERRED OUTFLOWS OF RESOURCES 10,198,914 Pension Related 45,683 22,572 39,165 2,045,677 OPER 5,081 2903 4718 7756 66,023 10.887 2,219,120 31.345 Gov. Fund balance, End of year 13,261,803 TOTAL DEFERRED OUTFLOWS OF RESOURCES 50,764 25,475 43,883 Ambulance Fund balance, End of year 2,266,482 2,053,433 76,900 2,250,465 EDA Fund balance, End of year 1366625 LIABILITIES $16,894,910 CURRENT LIABILITIES Accounts and Contracts Payable 1,161,430 5,802 79,654 1,592,522 55,319 2,894,727 Accrued Expenses 14,974 7,604 19,721 1,357,345 27,103 1,426,747 Due to Other Funds 836,129 836,129 Accrued Interest 37,904 34,358 12,481 31,464 116,207 Estimated Third-Party Payor Settlements 392,054 392,054 Windom Area Health, Windom, Minnesota STATEMENT OF REVENUES, EXPENSES AND CHANGES IN NET POSITION Year ended April 30, 2024 Primary Enterprise Unearned Revenue 98.233 197,042 7,374 302,649 Lease Liability-Current Portion 1,161 5,541 447,212 1,161 455,075 Other Postemployment Benefits Liability-Current Portion 5,081 10,887 Bonds Payable-Current Portion 1.60.000 $10.450 Total Current Liabilities 1,477,622 562,278 731,000 1,886,286 265.000 4,054,133 217.229 1883,679 350,537 8.330,856 LONG-TERM LIABILITIES Compensated Absences-Long-Ter 76,694 49,046 Total Reporting REVENUE (Hospital) Component Unit (Foundation) Net Pension Liability 224,817 111,085 87,861 192,740 115,536 329,127 6,213,355 OPEB Liability 54,277 31,016 50,400 70,099 324,915 116309 7,066,912 Net Patient Service Reve Other Revenue, Net Total Revenue EXPENSES $28,643,637 555,008 29,198,705 50,094 50,094 (Memo Only) $28,643,637 605.162 29,248,799 Bonds Payable-Long-Term 6,481,081 5,507,412 4,996,736 3,291,628 3.588.321 322,101 23,866,078 Lease Payable-Long Term 3,776 11.061 1.280.554 3,776 1.308167 Total Long-Term Liabilities 6837.709 TOTAL LIABILITIES 8,315,391 5,702,335 6,264,613 5.338 798 10,864,636 4,148,847 32892 385 7,225,084 14,918,769 4,499,384 41,223,241 DEFERRED INFLOWS OF RESOURCES Nursing Services 8,957,776 8,957,776 118,198 Other Professional Services 7,463,658 7,463,658 Leases Related General Services 1,611,893 1,611,893 Pension Related 158.181 28.159 242,990 135611 118,198 242,990 2073084 28.610 2.673.645 Administrative and Fiscal Services 7,910,632 25 7,910,657 TOTAL DEFERRED INFLOWS Depreciation and Amortization 1,921,417 Total Expenses 27.865.376 1921.417 27,865,401 OF RESOURCES 158.181 28.150 378.601 2,191.282 228610 3014833 NET POSITION INCOME FROM OPERATIONS 1.333.329 50,069 1383,398 Net Investment in Capital Assets Restricted for Specific Door Restrictions 14,450,911 15,734,091 (4,669,764) Restricted for Debt Service 19,337,504 10,353 400,978 49,450,098 10,353 400,978 NONOPERATING REVENUE AND EXPENSES Unrestricted TOTAL NET POSITION 4.141.653 $18,592,564 Investment Income 858,010 3.979.331 $19,713,412 (474.284) (85,144,848) 14.531.59 3.280.230 $34,280,364 $7.877.586 25.458 459 $75.319.888 Interest Expense (380,731) Noncapital Grants and Contribution 279,116 16,471 $58,010 (380,731) 295,587 Loss on Disposal of Assets (6.588) Total Nonoperating Revenue and Expenses 766218 *Nonmajor Proprietary Funds includes Water Liquor Arena, Multi-Purpose Center and River Bluff Townhomes Funds STATEMENT OF CASH FLOW Proprietary Funds, for the year ended December 31, 2024 EXCESS OF REVENUE OVER EXPENSES BEFORE CAPITAL April 30, 2024 GRANTS AND CONTRIBUTIONS 2,083,136 66,540 2,149,676 Electric Fund Wastewater Fund Telecom Fund Windom Area Health Fund Other Proprietary Total CASH FLOWS FROM OPERATING Capital Grants and Contributions 30,033 Expenses Paid on Behalf of Related Party (47,820) 30,033 (47,830) ACTIVITIES Cash Received from Customers Related Party Transfers 47,820 (47,820) and Service Users Cash Paid to Supplies 5,817,737 (4,537,892) EQUITY DISTRIBUTIONS (172,605) (172,605) Cash Paid to Employees (638.311) 1,743,300 (409,975) (334,282) 2,754,910 (1.383,470) (604.651) NET CASH PROVIDED (USED) BY OPERATING ACTIVITIES 999,043 27,182,334 (14,481,126) (10,424,255) 2,276,953 2,250,116 39,748,397 (1,221,703) (22,034,166) (1,046,971) (18,558) (13,048,470) 4,665,761 INCREASE IN NET POSITION 1,940,474 1,959,194 NET POSITION CASH FLOWS FROM NONCAPITAL Beginning of Year End of Year 32.139.800 $34,280,364 FINANCING ACTIVITIES 464618 $483.358 32.804.528 $34,763,722 Transfers (In) Out (200,750) (58,974) (2,250) (85,590) (347,564) Due to Other Funds 3,381 832,748 836,129 Property Tax Revenues Miscellaneous Revenues 17,520 517,790 535,310 (4.589) 279.116 274.527 City of Windom, Minnesota NOTES TO THE BASIC FINANCIAL STATEMENTS December 31, 2024 The following is a schedule of changes in noncument liabilities for the year ended December 31, 2024: NET CASH PROVIDED (USED) BY NONCAPITAL FINANCING ACTIVITIES (197,369) (41,454) 825,909 279,116 432,200 1,298,402 CASH FLOWS FROM CAPITAL AND RELATED FINANCING ACTIVITIES Proceeds from Bonds and Notes 50,001 Beginning Due within of Year Additions Retirements End of Year One Year Governmental activities: General obligation bonds 9,065,000 805,000 $,250,000 830,000 Assessments and Loans Receivable Proceeds from Sale of Capital Assets Equity Distributions to City of Windom (172,695) Capital Grants and Contributions 30,033 (172,695) 30,033 Bond subtotal Bond premium 9,065,000 805,000 8,250,000 830,000 Acquisition and Construction of 321,879 107.235 214,644 Net bond subtotal (8,737,899) 9,386,879 912-235 8,474,644 830,000 Lease obligations 59,592 109,039 55.254 Term Debt (219,720) (6,459) (83,728) (26,381) (150,104) (8,021,445) (378,071) (674,492) (87,705) (17,466,676) (919,328) 113,377 41,452 Compensated absences 259.324 12,862 246,462 Total $9.705.795 $109.039 $980.351 $8.834.483 $871.452 Principal Payments on Lease Obligation Principal Payments on Bonds and Notes NET CASH PROVIDED (USED) BY CAPITAL AND RELATED (95) (503.563) (6,373) (719,000) (403,193) (255.000) (95) (191,410) (409,756) (1.668973) Business-type activities: FINANCING ACTIVITIES (8,957,619) (593,845) (901,858) (9,150,370) (953,702) (20,557,394) General obligation bonds 12,540,000 General obligation revenue bonds Bond subtotal 9.832.000 22,372,000 50.000 50,000 Bond premium Bond discount Net bond subtotal 591.785 (48.626) 22,915,159 555,000 11,985,000 874.000 9,008.000 1,429,000 20,993,000 1,641,000 169,082 422.703 745,000 CASH FLOWS FROM $96.000 INVESTING ACTIVITIES Purchase of Investments (20.254) (28.372) Sale of Investments Note payable-direct borrowings 4,599.281 50,000 3,118 1,577,828 21,387,331 1,641,000 Expenses Paid on Behalf of Related Party (14,241,763) 14,241,763 (47,820) 239,973 4,362,426 242,679 Transfer from (to) Related Party 47,820 (14,241,763) 14,241,763 (47.820) 47,820 Lease obligations 473,495 1,699,503 Compensated absences 392 664 Total business-type activities Total debt 409,756 1,763,242 329.127 28.380.599 1.752.621 2,291,094 27,842,126 2.338,754 $38.086.394 $1.861.660 $3.271.445 $36.676.609 455,075 Net Cash Provided (Used) by Investing Activities 323,383 162,370 48.389 858,010 135,947 1.528099 NET CASH PROVIDED (USED) $3.210.206 BY INVESTING ACTIVITIES 323383 162,370 48,389 858,010 135,947 1528099 *Nonmajor Proprietary Funds includes Water, Liquor, Arena, Multi-Purpose Center and River Bluff Townhomes Finds REVENUES Local property taxes Total 2024 1,281,709 City of Windom , Minnesota SUMMARY FINANCIAL REPORT The purpose of this report is to provide a summary of financial information concerning the City of Windom to interested citizens . The complete financial statements may be examined at the City Hall , 444 9th Street . Questions about this report should be directed to Steven Nasby , City Administrator at 507-831-6129 . REVENUES AND EXPENDITURES FOR GENERAL OPERATIONS Governmental Funds Sales OPERATING REVENUES Cost of Goods Sold Charges for Services Charges for Materials and Labor Facility use other revenue TOTAL GROSS PROFIT & OPERATING REVENUES OPERATING EXPENSES Cost of Power Personal Services Other Professional Services Administrative and Gen Depreciation and Amortization Other Operating Expense TOTAL OPERATING EXPENSES OPERATING INCOME ( LOSS ) OTHER INCOME ( EXPENSES ) Interest Income Interest Expense and Bond Issue Costs Gain ( Loss ) on Sale of Capital Assets Taxes and Special Assessments Contributions and Reimbursements STATEMENT OF REVENUES , EXPENSES AND CHANGES IN NET POSITION Proprietary Funds For the year ended December 31 , 2024 Electric Fund Wastewater Fund Telecom Fund April 30 , 2024 Windom Area Health Fund Other Proprietary Funds Totals 2,237,978 ( 1,605,854 ) 2.237,978 6,198,416 1,732,147 2,766,280 28,643,637 ( 1,605,854 ) 39,340,480 555,068 1,168,236 346,059 1,168,226 901,127 6,198,416 1,732,147 2,766,280 29,198,705 2,146,409 42,041,957 3,422,320 3,422,320 623,432 336,824 609,140 8957,776 1,051,208 11.578.380 7,463,658 7,463,658 641,492 382,635 1,309,305 7,910,632 674,920 10,918,984 856,690 986,809 334,613 1,921,417 505,917 4,605,446 26991 1611803 374004 2012.08 5.543934 1,206,268 2.280089 27.865 376 2606019 40.001,676 654,482 25,879 486,231 1,333.329 ( 459,640 ) 2,040,281 323,383 162,370 ( 240,319 ) ( 13,319 ) 48,389 ( 133,900 ) 135,947 1,528,099 ( 380,731 ) 36223 ) ( 794,492 ) $ 17,790 279.116 279.116 Lodging Tax 52.717 Special Assessments 13,004 TOTAL OTHER INCOME ( EXPENSES ) 83,064 149,061 ( 85.511 ) 749.807 627514 1.523.925 Licenses , Permits and Fees 96,982 Intergovernmental 8,992,342 INCOME BEFORE CONTRIBUTIONS AND TRANSFERS 737,546 174,930 400,720 2,083,136 167,874 3,564,206 Charges for services and facilities 316,793 Fines and forfeits 27,377 Interest Investment income 227,371 CONTRIBUTIONS AND TRANSFERS Transfers In 72,084 72,084 Ambulance 505,729 Transfers Out ( 200,750 ) ( 58974 ) ( 2,250 ) ( 157,674 ) ( 419,648 ) EDA Other revenues 1,160,572 Capital Contributions Total revenues 143,042 12.817.638 Equity Distributions 30,033 ( 172.605 ) ( 172.695 ) TOTAL CONTRIBUTIONS AND TRANSFERS ( 200,750 ) ( 58,974 ) ( 2,250 ) ( 142662 ) ( 85.090 ) EXPENDITURES CHANGE IN NET POSITION 536,796 115,956 398,470 1,940,474 Current NET POSITION - BEGIN , OF YEAR 18,055,708 General government 583,173 Public safety 1,694,018 NET POSITION - END OF YEAR $ 18,592,564 19,597,466 $ 19,713,422 ( 5.542.518 ) ( $ 5,144,848 ) 37.330.800 82,784 7.394802 3,074,480 72.245.408 $ 34,280,364 $ 7.877.586 $ 75.319.888 Public works 702,815 Parks and Recreation 731,090 EDA 593.234 Ambulance 629,512 Capital Outlay : Ambulance * Nonmajor Proprietary Funds includes Water , Liquor , Arena Multi - Purpose Center and River Bluff Townhomes Funds STATEMENT OF NET POSITION Proprietary Funds , December 31 , 2024 EDA Other 1,294,088 Debt service : Electric Fund Wastewater Fund Telecom Fund April 30 , 2024 Windom Area Health Fund Other Proprietary Funds Totals ASSETS General Government Principal 55,254 CURRENT ASSETS Interest and Fiscal Charges 5,716 Cash and Cash Equivalents 3,503,222 3,995,107 EDA Principal 150,000 Restricted Cash and Investments EDA Interest and Fiscal Charges Accounts Receivable , Net of Allowance 963,636 252,155 739,229 265,050 18,063,198 3,668,863 29,969,619 400,978 400,978 6,274,562 60,334 7,815,727 Interest and Fiscal Charges Accrued Interest Receivable 150,277 150,277 Total Expenditures 6.450,816 Other Receivables 221,690 221,690 Special Assessments Receivable 19,299 27,135 46,434 Excess of revenues over ( under ) expenditures OTHER FINANCING SOURCES Lease Issuance Inventory 7,268 239,524 364,495 611,287 6366822 Prepaid Items Total Current Assets 1.18942 5,649,790 87.300 142.108 1407440 4,273,829 25.492.337 4,120,827 40,623,452 LONG TERM ASSETS 109,039 Investment in Joint Venture 108,171 108,171 EDA Property Held for Sale - Market Adj Leases Receivable 254,511 254,511 General Government Operating transfers in 249,500 Capital Assets Bucure General Government Operating transfers out ( 72,084 ) General Fund Sale of Capital Assets 42,719 Equipment General Fund Sale of Land Held for Resale Construction in Progress Total Capital Assets 19,859,705 7,240,615 6218.451 33,318,771 27,266,411 5,420,962 32,687,373 5,076,641 6,353,147 135.238 11,565,026 18,025,491 19,616,849 7712.173 45,354,513 16,391,681 5,561,126 86,619,929 44,192,699 21,952,807 14.065.862 144,878,490 Net Change in fund balances 6,695,996 Less : Allowance for Depreciation and Amortization ( 11.953,189 ) ( 10.90.483 ) ( 10.490.45 % ) General Government Fund balance , Total Net Capital Assets 21.35582 21.756800 beginning of year 6,847,446 Total Long - Term Assets 21.365482 21.756800 1074.574 1.320.085 C1618.019 ) 23,736.474 23.844645 ( 13.541964 ) Ambulance Fund balance , beginning of year 2.390,265 TOTAL ASSETS 27,015,372 26,030,719 2,415,754 49,336,982 8.407.843 8407843 12.528,670 76.341.36 76,704085 117,327,497 EDA Fund balance , beginning of year 961.203 DEFERRED OUTFLOWS OF RESOURCES 10,198,914 Pension Related 45,683 22,572 39,165 2,045,677 OPER 5,081 2903 4718 7756 66,023 10.887 2,219,120 31.345 Gov. Fund balance , End of year 13,261,803 TOTAL DEFERRED OUTFLOWS OF RESOURCES 50,764 25,475 43,883 Ambulance Fund balance , End of year 2,266,482 2,053,433 76,900 2,250,465 EDA Fund balance , End of year 1366625 LIABILITIES $ 16,894,910 CURRENT LIABILITIES Accounts and Contracts Payable 1,161,430 5,802 79,654 1,592,522 55,319 2,894,727 Accrued Expenses 14,974 7,604 19,721 1,357,345 27,103 1,426,747 Due to Other Funds 836,129 836,129 Accrued Interest 37,904 34,358 12,481 31,464 116,207 Estimated Third - Party Payor Settlements 392,054 392,054 Windom Area Health , Windom , Minnesota STATEMENT OF REVENUES , EXPENSES AND CHANGES IN NET POSITION Year ended April 30 , 2024 Primary Enterprise Unearned Revenue 98.233 197,042 7,374 302,649 Lease Liability - Current Portion 1,161 5,541 447,212 1,161 455,075 Other Postemployment Benefits Liability - Current Portion 5,081 10,887 Bonds Payable - Current Portion 1.60.000 $ 10.450 Total Current Liabilities 1,477,622 562,278 731,000 1,886,286 265.000 4,054,133 217.229 1883,679 350,537 8.330,856 LONG - TERM LIABILITIES Compensated Absences - Long - Ter 76,694 49,046 Total Reporting REVENUE ( Hospital ) Component Unit ( Foundation ) Net Pension Liability 224,817 111,085 87,861 192,740 115,536 329,127 6,213,355 OPEB Liability 54,277 31,016 50,400 70,099 324,915 116309 7,066,912 Net Patient Service Reve Other Revenue , Net Total Revenue EXPENSES $ 28,643,637 555,008 29,198,705 50,094 50,094 ( Memo Only ) $ 28,643,637 605.162 29,248,799 Bonds Payable - Long - Term 6,481,081 5,507,412 4,996,736 3,291,628 3.588.321 322,101 23,866,078 Lease Payable - Long Term 3,776 11.061 1.280.554 3,776 1.308167 Total Long - Term Liabilities 6837.709 TOTAL LIABILITIES 8,315,391 5,702,335 6,264,613 5.338 798 10,864,636 4,148,847 32892 385 7,225,084 14,918,769 4,499,384 41,223,241 DEFERRED INFLOWS OF RESOURCES Nursing Services 8,957,776 8,957,776 118,198 Other Professional Services 7,463,658 7,463,658 Leases Related General Services 1,611,893 1,611,893 Pension Related 158.181 28.159 242,990 135611 118,198 242,990 2073084 28.610 2.673.645 Administrative and Fiscal Services 7,910,632 25 7,910,657 TOTAL DEFERRED INFLOWS Depreciation and Amortization 1,921,417 Total Expenses 27.865.376 1921.417 27,865,401 OF RESOURCES 158.181 28.150 378.601 2,191.282 228610 3014833 NET POSITION INCOME FROM OPERATIONS 1.333.329 50,069 1383,398 Net Investment in Capital Assets Restricted for Specific Door Restrictions 14,450,911 15,734,091 ( 4,669,764 ) Restricted for Debt Service 19,337,504 10,353 400,978 49,450,098 10,353 400,978 NONOPERATING REVENUE AND EXPENSES Unrestricted TOTAL NET POSITION 4.141.653 $ 18,592,564 Investment Income 858,010 3.979.331 $ 19,713,412 ( 474.284 ) ( 85,144,848 ) 14.531.59 3.280.230 $ 34,280,364 $ 7.877.586 25.458 459 $ 75.319.888 Interest Expense ( 380,731 ) Noncapital Grants and Contribution 279,116 16,471 $ 58,010 ( 380,731 ) 295,587 Loss on Disposal of Assets ( 6.588 ) Total Nonoperating Revenue and Expenses 766218 * Nonmajor Proprietary Funds includes Water Liquor Arena , Multi - Purpose Center and River Bluff Townhomes Funds STATEMENT OF CASH FLOW Proprietary Funds , for the year ended December 31 , 2024 EXCESS OF REVENUE OVER EXPENSES BEFORE CAPITAL April 30 , 2024 GRANTS AND CONTRIBUTIONS 2,083,136 66,540 2,149,676 Electric Fund Wastewater Fund Telecom Fund Windom Area Health Fund Other Proprietary Total CASH FLOWS FROM OPERATING Capital Grants and Contributions 30,033 Expenses Paid on Behalf of Related Party ( 47,820 ) 30,033 ( 47,830 ) ACTIVITIES Cash Received from Customers Related Party Transfers 47,820 ( 47,820 ) and Service Users Cash Paid to Supplies 5,817,737 ( 4,537,892 ) EQUITY DISTRIBUTIONS ( 172,605 ) ( 172,605 ) Cash Paid to Employees ( 638.311 ) 1,743,300 ( 409,975 ) ( 334,282 ) 2,754,910 ( 1.383,470 ) ( 604.651 ) NET CASH PROVIDED ( USED ) BY OPERATING ACTIVITIES 999,043 27,182,334 ( 14,481,126 ) ( 10,424,255 ) 2,276,953 2,250,116 39,748,397 ( 1,221,703 ) ( 22,034,166 ) ( 1,046,971 ) ( 18,558 ) ( 13,048,470 ) 4,665,761 INCREASE IN NET POSITION 1,940,474 1,959,194 NET POSITION CASH FLOWS FROM NONCAPITAL Beginning of Year End of Year 32.139.800 $ 34,280,364 FINANCING ACTIVITIES 464618 $ 483.358 32.804.528 $ 34,763,722 Transfers ( In ) Out ( 200,750 ) ( 58,974 ) ( 2,250 ) ( 85,590 ) ( 347,564 ) Due to Other Funds 3,381 832,748 836,129 Property Tax Revenues Miscellaneous Revenues 17,520 517,790 535,310 ( 4.589 ) 279.116 274.527 City of Windom , Minnesota NOTES TO THE BASIC FINANCIAL STATEMENTS December 31 , 2024 The following is a schedule of changes in noncument liabilities for the year ended December 31 , 2024 : NET CASH PROVIDED ( USED ) BY NONCAPITAL FINANCING ACTIVITIES ( 197,369 ) ( 41,454 ) 825,909 279,116 432,200 1,298,402 CASH FLOWS FROM CAPITAL AND RELATED FINANCING ACTIVITIES Proceeds from Bonds and Notes 50,001 Beginning Due within of Year Additions Retirements End of Year One Year Governmental activities : General obligation bonds 9,065,000 805,000 $ , 250,000 830,000 Assessments and Loans Receivable Proceeds from Sale of Capital Assets Equity Distributions to City of Windom ( 172,695 ) Capital Grants and Contributions 30,033 ( 172,695 ) 30,033 Bond subtotal Bond premium 9,065,000 805,000 8,250,000 830,000 Acquisition and Construction of 321,879 107.235 214,644 Net bond subtotal ( 8,737,899 ) 9,386,879 912-235 8,474,644 830,000 Lease obligations 59,592 109,039 55.254 Term Debt ( 219,720 ) ( 6,459 ) ( 83,728 ) ( 26,381 ) ( 150,104 ) ( 8,021,445 ) ( 378,071 ) ( 674,492 ) ( 87,705 ) ( 17,466,676 ) ( 919,328 ) 113,377 41,452 Compensated absences 259.324 12,862 246,462 Total $ 9.705.795 $ 109.039 $ 980.351 $ 8.834.483 $ 871.452 Principal Payments on Lease Obligation Principal Payments on Bonds and Notes NET CASH PROVIDED ( USED ) BY CAPITAL AND RELATED ( 95 ) ( 503.563 ) ( 6,373 ) ( 719,000 ) ( 403,193 ) ( 255.000 ) ( 95 ) ( 191,410 ) ( 409,756 ) ( 1.668973 ) Business - type activities : FINANCING ACTIVITIES ( 8,957,619 ) ( 593,845 ) ( 901,858 ) ( 9,150,370 ) ( 953,702 ) ( 20,557,394 ) General obligation bonds 12,540,000 General obligation revenue bonds Bond subtotal 9.832.000 22,372,000 50.000 50,000 Bond premium Bond discount Net bond subtotal 591.785 ( 48.626 ) 22,915,159 555,000 11,985,000 874.000 9,008.000 1,429,000 20,993,000 1,641,000 169,082 422.703 745,000 CASH FLOWS FROM $ 96.000 INVESTING ACTIVITIES Purchase of Investments ( 20.254 ) ( 28.372 ) Sale of Investments Note payable - direct borrowings 4,599.281 50,000 3,118 1,577,828 21,387,331 1,641,000 Expenses Paid on Behalf of Related Party ( 14,241,763 ) 14,241,763 ( 47,820 ) 239,973 4,362,426 242,679 Transfer from ( to ) Related Party 47,820 ( 14,241,763 ) 14,241,763 ( 47.820 ) 47,820 Lease obligations 473,495 1,699,503 Compensated absences 392 664 Total business - type activities Total debt 409,756 1,763,242 329.127 28.380.599 1.752.621 2,291,094 27,842,126 2.338,754 $ 38.086.394 $ 1.861.660 $ 3.271.445 $ 36.676.609 455,075 Net Cash Provided ( Used ) by Investing Activities 323,383 162,370 48.389 858,010 135,947 1.528099 NET CASH PROVIDED ( USED ) $ 3.210.206 BY INVESTING ACTIVITIES 323383 162,370 48,389 858,010 135,947 1528099 * Nonmajor Proprietary Funds includes Water , Liquor , Arena , Multi - Purpose Center and River Bluff Townhomes Finds