
Advertisement
-
Published Date
August 12, 2021This ad was originally published on this date and may contain an offer that is no longer valid. To learn more about this business and its most recent offers, click here.
Ad Text
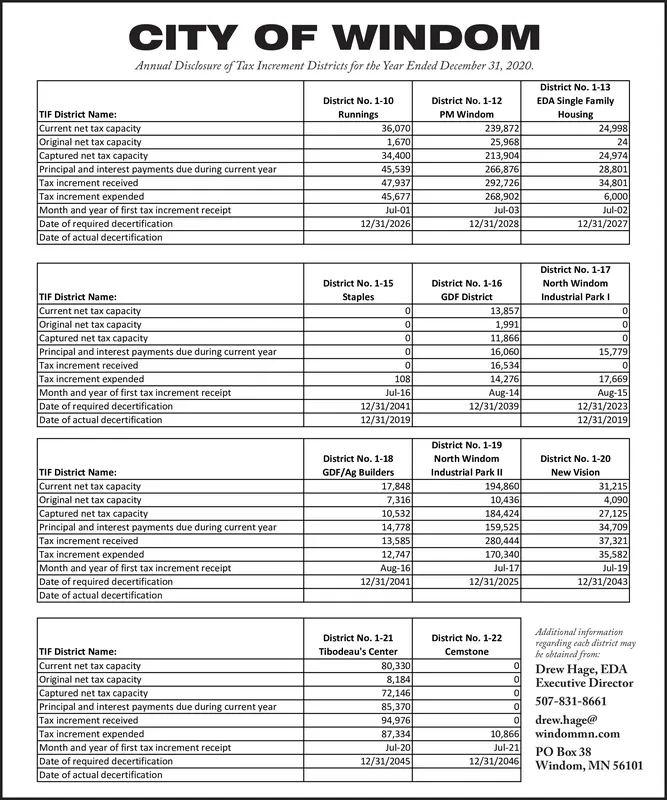
CITY OF WINDOM Annual Disclosure of Tax Increment Districts for the Year Ended December 31, 2020. District No. 1-13 District No. 1-10 District No. 1-12 EDA Single Family TIF District Name: Current net tax capacity Original net tax capacity Captured net tax capacity Principal and interest payments due during current year Tax increment received Tax increment expended Month and year of first tax increment receipt Date of required decertification Date of actual decertification Runnings PM Windom Housing 239,872 25,968 213,904 266,876 292,726 268,902 Jul-03 12/31/2028 24,998 36,070 1,670 24 34,400 45,539 24,974 28,801 47,937 34,801 45,677 6,000 Jul-01 Jul-02 12/31/2026 12/31/2027 District No. 1-17 District No. 1-15 District No. 1-16 North Windom TIF District Name: Current net tax capacity Original net tax capacity Captured net tax capacity Principal and interest payments due during current year Tax increment received Tax increment expended Month and year of first tax increment receipt Date of required decertification Staples GDF District Industrial Park I 13,857 1,991 11,866 16,060 16,534 14,276 Aug-14 12/31/2039 0. 15,779 17,669 Aug-15 12/31/2023 12/31/2019 108 Jul-16 12/31/2041 12/31/2019 Date of actual decertification District No. 1-19 District No. 1-18 North Windom District No. 1-20 TIF District Name: Current net tax capacity Original net tax capacity Captured net tax capacity Principal and interest payments due during current year Tax increment received Tax increment expended Month and year of first tax increment receipt Date of required decertification Date of actual decertification GDF/Ag Builders 17,848 Industrial Park Il New Vision 194,860 10,436 184,424 159,525 280,444 170,340 Jul-17 12/31/2025 31,215 4,090 27,125 34,709 7,316 10,532 14,778 13,585 12,747 Aug-16 12/31/2041 37,321 35,582 Jul-19 12/31/2043 Additional information regarding each district may be obtained from: Drew Hage, EDA Executive Director District No. 1-21 District No. 1-22 TIF District Name: Current net tax capacity Original net tax capacity Captured net tax capacity Principal and interest payments due during current year Tax increment received Tax increment expended Month and year of first tax increment receipt Date of required decertification Date of actual decertification Tibodeau's Center Cemstone 80,330 8,184 72,146 85,370 94,976 87,334 Jul-20 12/31/2045 ol 507-831-8661 O drew.hage@ windommn.com x 38 Windom, MN 56101 10,866 Jul-21 12/31/2046 CITY OF WINDOM Annual Disclosure of Tax Increment Districts for the Year Ended December 31, 2020. District No. 1-13 District No. 1-10 District No. 1-12 EDA Single Family TIF District Name: Current net tax capacity Original net tax capacity Captured net tax capacity Principal and interest payments due during current year Tax increment received Tax increment expended Month and year of first tax increment receipt Date of required decertification Date of actual decertification Runnings PM Windom Housing 239,872 25,968 213,904 266,876 292,726 268,902 Jul-03 12/31/2028 24,998 36,070 1,670 24 34,400 45,539 24,974 28,801 47,937 34,801 45,677 6,000 Jul-01 Jul-02 12/31/2026 12/31/2027 District No. 1-17 District No. 1-15 District No. 1-16 North Windom TIF District Name: Current net tax capacity Original net tax capacity Captured net tax capacity Principal and interest payments due during current year Tax increment received Tax increment expended Month and year of first tax increment receipt Date of required decertification Staples GDF District Industrial Park I 13,857 1,991 11,866 16,060 16,534 14,276 Aug-14 12/31/2039 0. 15,779 17,669 Aug-15 12/31/2023 12/31/2019 108 Jul-16 12/31/2041 12/31/2019 Date of actual decertification District No. 1-19 District No. 1-18 North Windom District No. 1-20 TIF District Name: Current net tax capacity Original net tax capacity Captured net tax capacity Principal and interest payments due during current year Tax increment received Tax increment expended Month and year of first tax increment receipt Date of required decertification Date of actual decertification GDF/Ag Builders 17,848 Industrial Park Il New Vision 194,860 10,436 184,424 159,525 280,444 170,340 Jul-17 12/31/2025 31,215 4,090 27,125 34,709 7,316 10,532 14,778 13,585 12,747 Aug-16 12/31/2041 37,321 35,582 Jul-19 12/31/2043 Additional information regarding each district may be obtained from: Drew Hage, EDA Executive Director District No. 1-21 District No. 1-22 TIF District Name: Current net tax capacity Original net tax capacity Captured net tax capacity Principal and interest payments due during current year Tax increment received Tax increment expended Month and year of first tax increment receipt Date of required decertification Date of actual decertification Tibodeau's Center Cemstone 80,330 8,184 72,146 85,370 94,976 87,334 Jul-20 12/31/2045 ol 507-831-8661 O drew.hage@ windommn.com x 38 Windom, MN 56101 10,866 Jul-21 12/31/2046